PyTorch Performance Tuning
Goal: Accelerate training and performance.
Good resources
- https://docs.pytorch.org/tutorials/recipes/recipes/tuning_guide.html
- https://docs.pytorch.org/tutorials/intermediate/pinmem_nonblock.html
- https://docs.pytorch.org/docs/stable/notes/cuda.html
from torch.profiler import profile, record_function, ProfilerActivity

with profile(
    activities=[ProfilerActivity.CPU, ProfilerActivity.CUDA],
    schedule=torch.profiler.schedule(wait=10, warmup=10, active=20, repeat=1),

it = iter(train_dataloader)
    on_trace_ready=torch.profiler.tensorboard_trace_handler("./tb_trace"),
) as prof:
    for step in range(num_steps):
        with record_function("data_wait"):
            X, y = next(it)
        with record_function("h2d"):
            X = X.to(device, non_blocking=True)
            y = y.to(device, non_blocking=True)

        with record_function("fwd"):
            out = model(X)
            loss = loss_fn(out, y)

        with record_function("bwd"):
            loss.backward()

        with record_function("opt"):
            opt.step()
            opt.zero_grad(set_to_none=True)

        prof.step()
        if step >= 60: break
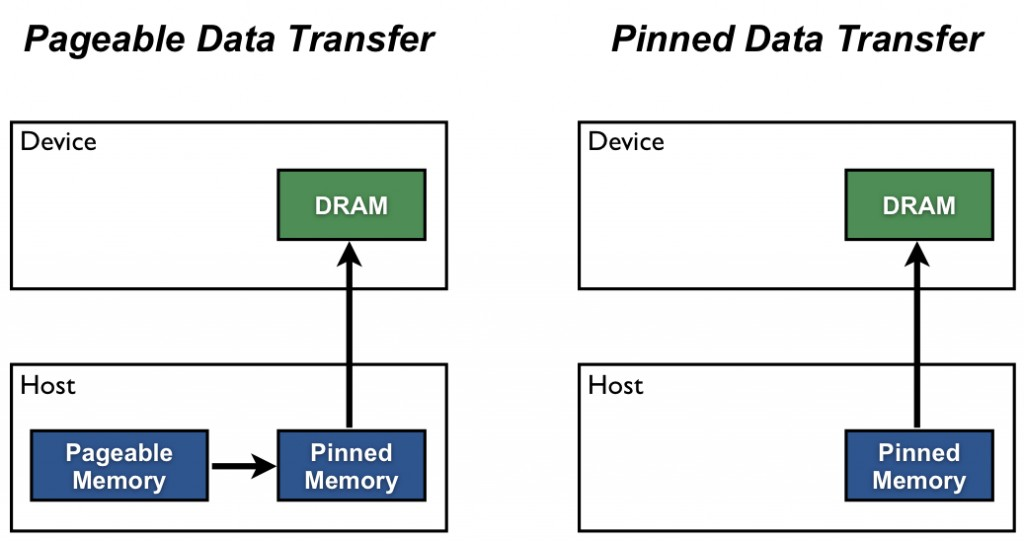
Pinned memory = page-locked = non-pageable memory
- Cannot be swapped out to disk
Who copies data from GPU to CPU?
There is a DMA engine. Most modern NVIDIA GPUs have dedicated copy engines (a.k.a. “DMA engines”) that can move data without using the GPU’s compute cores.
Increase utilization
A copy and a kernel execution can be done simultaneously on the GPU side if and only if:
- The device must have at least one free DMA (Direct Memory Access) engine. Modern GPU architectures such as Volterra, Tesla, or H100 devices have more than one DMA engine.
- The transfer must be done on a separate, non-default cuda stream. In PyTorch, cuda streams can be handles using Stream.
- The source data must be in pinned memory.
Write (RAM → disk):
- Your app writes into pageable memory.
- Kernel copies it into the page cache / kernel buffers.
- Later, the storage controller DMA’s from those kernel pages to the device.
Read (disk → RAM):
- Storage controller DMA’s into kernel pages (page cache).
- Kernel copies/maps data into your process when you read.
How this matches the GPU story
For GPU H2D from pageable memory, CUDA effectively does the same thing:
- copy into a pinned staging buffer (like the kernel page cache buffers)
- then DMA from that pinned buffer
Data flow: disk → pageable memory → pinned memory → GPU
Trying to understand pinned memory and kernel buffers
But you have the same problem when CPU is reading from other memory addresses? You don't need to first copy the data into some stable kernel buffer..?
- CPU access: page faults are fine (expected)
- DMA access: page faults are not fine
When the CPU reads/writes a pointer (like your program reading "5" from a buffer, or the kernel doing copy_from_user()),
From CPU side, any missing page triggers a page fault:
- CPU tries to load/store
- MMU sees the page isn’t present / lacks permission
- trap into the OS
- OS brings the page in (or allocates it / fixes permissions)
- resume the instruction
So if your buffer spans 10 pages and only 3 are resident, the CPU may fault a bunch of times — that’s normal.
When a device is doing DMA, it can’t handle page faults. So before starting DMA, the kernel must ensure:
- the pages exist and are resident (no page faults will be needed)
- the mapping the device uses stays valid during the transfer (no moving/swapping), so kernel will pin/lock this mapping
What happens when you do
pickle.dump(arr, f)?O (the common case):
- Your program produces bytes in a user buffer.
- You call
write(fd, user_buffer, n).- The kernel copies those bytes into a kernel buffer (Page Cache)
- Later, the disk DMA’s from that kernel buffer to the disk.
Both user memory and kernel memory are “paged”.
Different bottlenecks:
- data bound
- Compute bound
- memory bound
Roadmap (what to practice, in order)
Phase 1 — Instrumentation you’ll use forever (1–2 sessions)
- Measure throughput correctly
- Warm up (first ~10–50 steps are noisy)
- Time iteration wall-clock and also time GPU kernels (see below)
- Know the 3 profilers in PyTorch
- Quick check:
torch.utils.bottleneck(coarse “is it CPU Python or autograd?”) - Trace view:
torch.profiler→ TensorBoard trace (best for mapping ops back to code) - Kernel view: Nsight Systems/Compute (later, when you’re comfortable)
- Learn to spot “GPU starvation”
- In trace: large gaps where GPU stream is idle
- CPU thread busy in dataloader / Python
Milestone: you can answer: “Am I input-bound vs GPU-bound?” in <10 minutes.
Phase 2 — Data pipeline optimization (easy wins) (1–2 sessions)
Focus on “keep GPU fed”:
num_workers,pin_memory,persistent_workers- Move expensive CPU transforms out of
__getitem__(or use GPU transforms) - Avoid Python per-sample overhead: vectorize, cache, pre-decode, use larger batches
- Watch for accidental syncs:
.item(),print(tensor),tensor.cpu(),torch.cuda.synchronize()in the loop
Milestone: GPU idle gaps in trace shrink a lot.
Phase 3 — Step-time optimization (the real GPU work) (2–6 sessions)
Now assume your GPU is fed. Typical wins:
- Mixed precision:
torch.autocast+GradScaler torch.compile: reduces Python overhead, fuses ops- Better kernels / fused ops: replace patterns with fused versions
- Reduce tiny ops: fewer
view/permute/catinside hot path - Activation checkpointing (trade compute for memory, lets you increase batch)
- DDP / gradient accumulation (if scaling out)
Milestone: you can map the top 3 time-consuming ops in the trace back to specific lines of code and explain why they’re expensive.
Phase 4 — Apply to an open-source model (the “real” practice)
Pick something simple and common so there’s lots of reference:
-
ResNet-50 on CIFAR/ImageNet-lite (vision)
-
Small Transformer (e.g., nanoGPT-style) (NLP)
-
UNet on small dataset (diffusion-ish)
Goal: improve throughput by 1.3×–2× without changing accuracy meaningfully.
If it’s data-bound (GPU idle, gaps between kernels)
Goal: feed the GPU.
- Dataloader parallelism: increase
num_workers, usepersistent_workers=True,prefetch_factor>1 - Faster host→device:
pin_memory=True+.to(device, non_blocking=True) - Move work off the CPU: avoid heavy Python transforms; prefer vectorized ops or GPU transforms if available
- Cache / pre-decode: store decoded tensors, use dataset caching, avoid per-epoch expensive parsing
- Bigger batches / grad accumulation: fewer loader calls per “useful work”
- Overlapping transfer+compute: prefetch next batch to GPU in a separate stream (advanced, but nice to mention)
If it’s compute-bound (GPU busy doing math)
Goal: more FLOPs/sec per GPU.
- AMP (bf16/fp16): almost always first win
torch.compile: can fuse ops + reduce Python overhead (varies by model)- Flash attention / fused kernels (if attention heavy): use implementations that swap in fused attention
- Tune batch size: increase until near memory limit; or use grad accumulation
- Avoid tiny kernels: fuse ops, avoid Python loops in the step, vectorize
- Checkpointing (not faster, but lets you use bigger batch to get faster throughput)
If it’s memory-bound (GPU busy but limited by bandwidth)
Goal: reduce memory traffic.
- AMP helps a lot here too (smaller activations/gradients)
- Activation recompute / checkpointing (trade compute for less memory; enables larger batch)
- Reduce activation size: smaller seq len, lower resolution, smaller hidden size (if allowed)
- Fewer copies: avoid unnecessary
.contiguous(),.clone(), dtype/device ping-pong - Fused ops: fusion reduces intermediate tensors (again
torch.compilecan help)
If it’s overhead/sync-bound (GPU isn’t the problem)
Goal: stop stalling the GPU / stop Python from dominating.
- Don’t call
.item()/print()/ CPU metrics every step - Avoid
torch.cuda.synchronize()in the hot loop - Move logging to every N steps, aggregate metrics on GPU
- Use
optimizer.zero_grad(set_to_none=True)(minor but common) torch.compilecan reduce Python overhead a lot when it works