Sensitivity Graph
First introduced in ECE192.
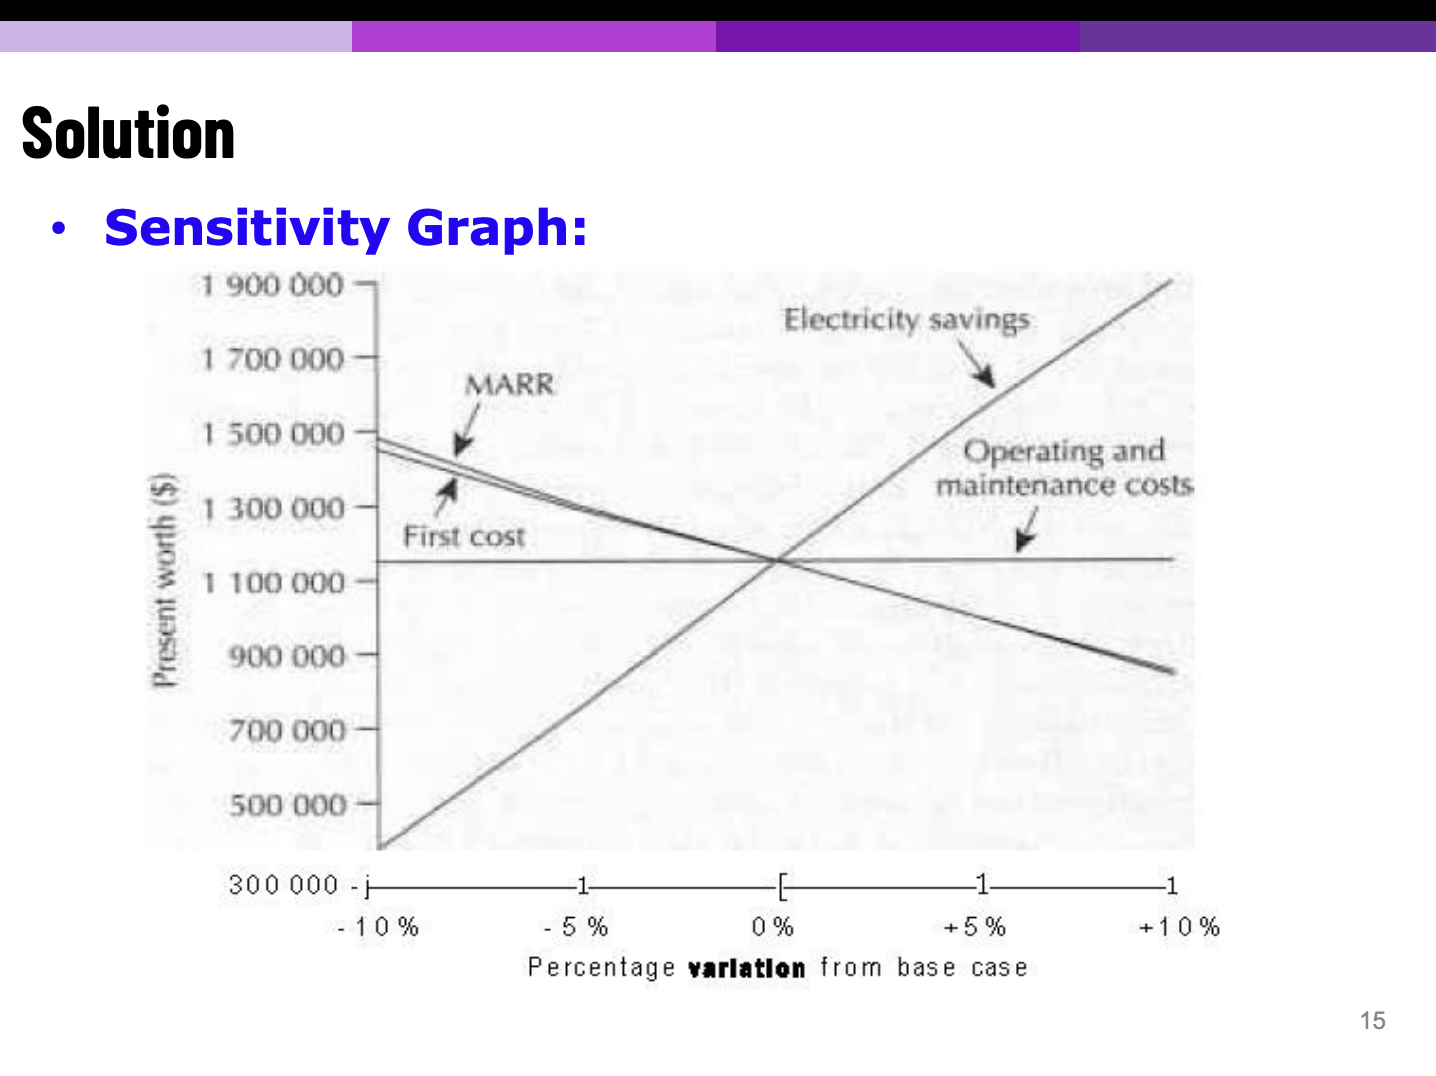
Sensitivity Graphs are used to asses the effect of one-at-a-time changes in key parameter values of a project on an economic performance measure.
Wait this example is so long
First introduced in ECE192.
Sensitivity Graphs are used to asses the effect of one-at-a-time changes in key parameter values of a project on an economic performance measure.
Wait this example is so long