htop
To show CPU load.
htop -d 1- To get it to update as fast as possible
Htop columns
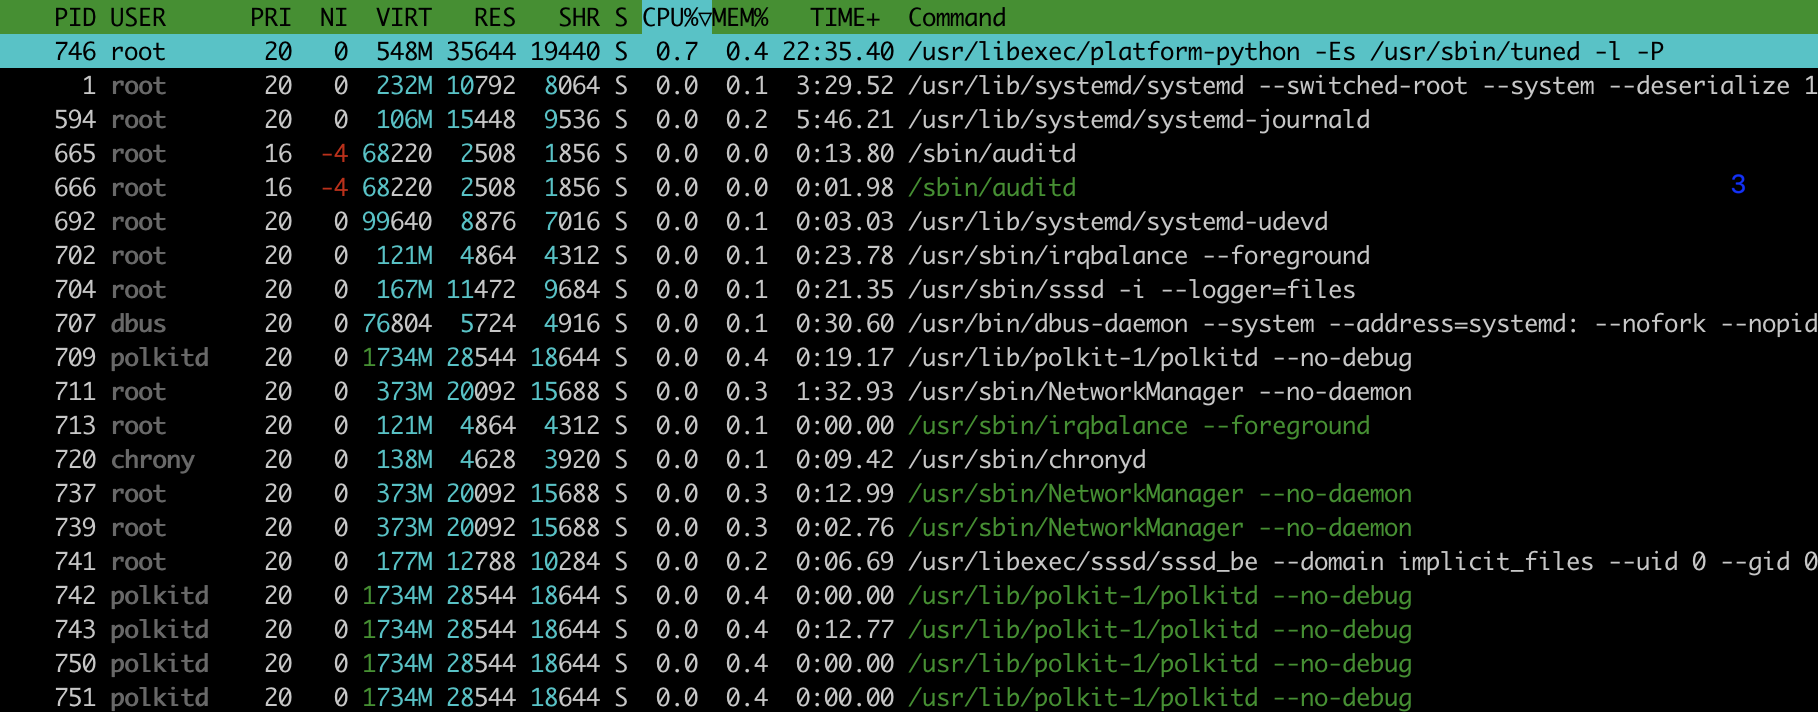
- PID: The process ID.
- USER: The username of the process owner or the user ID if the name can’t be determined.
- PRI (priority): The kernels internal priority for the process, usually just its NI value plus twenty. Different for real-time processes.
- NI (nice (Unix) priority): The nice value of a process, from 19 (low priority) to -20 (high priority). A high value means the process is being nice, letting others have a higher relative priority. Only root can lower the value.
- VIRT: Size in memory of the total program size.
- RES: The resident set size, i.e. the size of the text and data sections, plus stack usage.
- SHR: The size of the process’s shared pages.
- S: The state of the process.
- S: for sleeping (idle)
- R: for running
- D: for disk sleep (uninterruptible)
- Z: for zombie (waiting for parent to read its exit status)
- T: for traced or suspended (e.g by SIGTSTP)
- W: for paging
- CPU%: The percentage of the CPU time that the process is currently using.
- MEM%: The percentage of memory the process is currently using (based on the process’s resident memory size, see M_RESIDENT below).
- TIME+: The time, measured in clock ticks that the process has spent in user and system time (see UTIME, STIME above).
- Command: Full path of the command.
jtop
jtop is a command specifically for the Jetson. Learned during my internship.
Show both CPU and GPU usage.
jtop -r 1
- refreshes as fast as possible
To install, you can run
sudo -H pip3 install jetson-stats