Spectrogram
Spectrograms are graphs that depict Sound over time. Generated using Fourier Transforms. They show
- x-axis is time
- y-axis are the different frequencies
- color represents the intensity itself, in Decibel
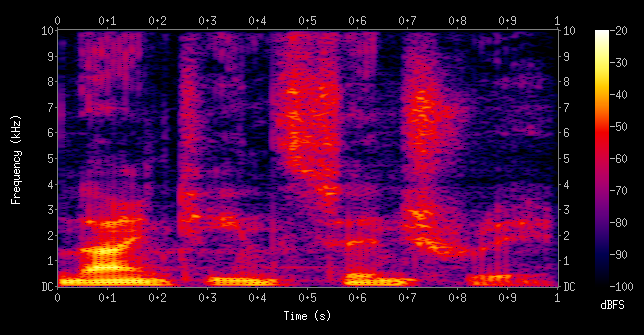
The graph shows time on the x-axis and frequency on the y-axis. The color indicates the amplitude of the specific frequency at a specific point in time.