ROC Curve
A ROC curve is a diagnostic ability of a binary classifier system as its discrimination threshold is varied.
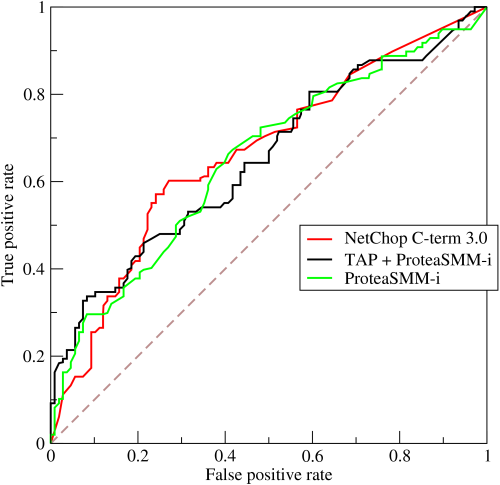
The ROC curve is drawn by calculating the true positive rate (TPR) and false positive rate (FPR) at every possible threshold (in practice, at selected intervals), then graphing TPR over FPR.
A perfect model has AUC = 1.0.
AUC = area under ROC Curve, Kai Ma introduced me to this idea
True Positive Rate (TPR) formula (this is just recall)
False Positive Rate (FPR) formula
- “among all negatives, how many did we incorrectly predict as positive”
How do we use the ROC curves + AUC?
AUC is a useful measure for comparing the performance of two different models, as long as the dataset is roughly balanced. The model with greater area under the curve is generally the better one.