Precision and Recall
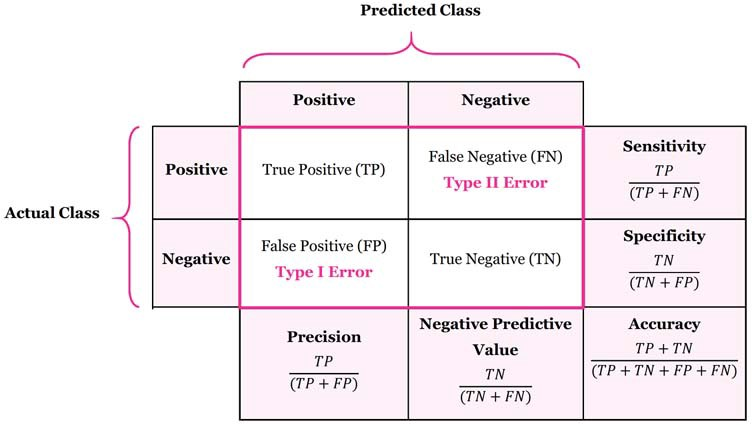
Recall = sensitivity
Also see Confusion Matrix. Precision-Recall curve is obtained by plotting the model’s precision and recall values as a function of the model’s confidence score threshold.
Precision is a measure of when “your model predicts how often does it predicts correctly?” It indicates how much we can rely on the model’s positive predictions.
Recall (also called sensitivity) is a measure of ""has your model predicted every time that it should have predicted?"" It indicates any predictions that it should not have missed if the model is missing.

Recall (true positive rate) is the probability of a positive test result, conditioned on the individual truly being positive. Specificity (true negative rate) is the probability of a negative test result, conditioned on the individual truly being negative.
Some personal thoughts: So if your model never predicts, it technically has 100% precision. On the other hand, there are a lot of samples where it should have predicted but hasn’t, so it would have 0% recall.
For example, in the medical industry, we want a very high precision, because we don’t want to misclassify.
#todo: Actually there is this thing that I heard related to statistics. which has to do with the fact that a vaccine is only 90% effective. And yet we use it. OH YES it is from the 6.042MIT course on probability and statistics.
Precision-Recall Curve
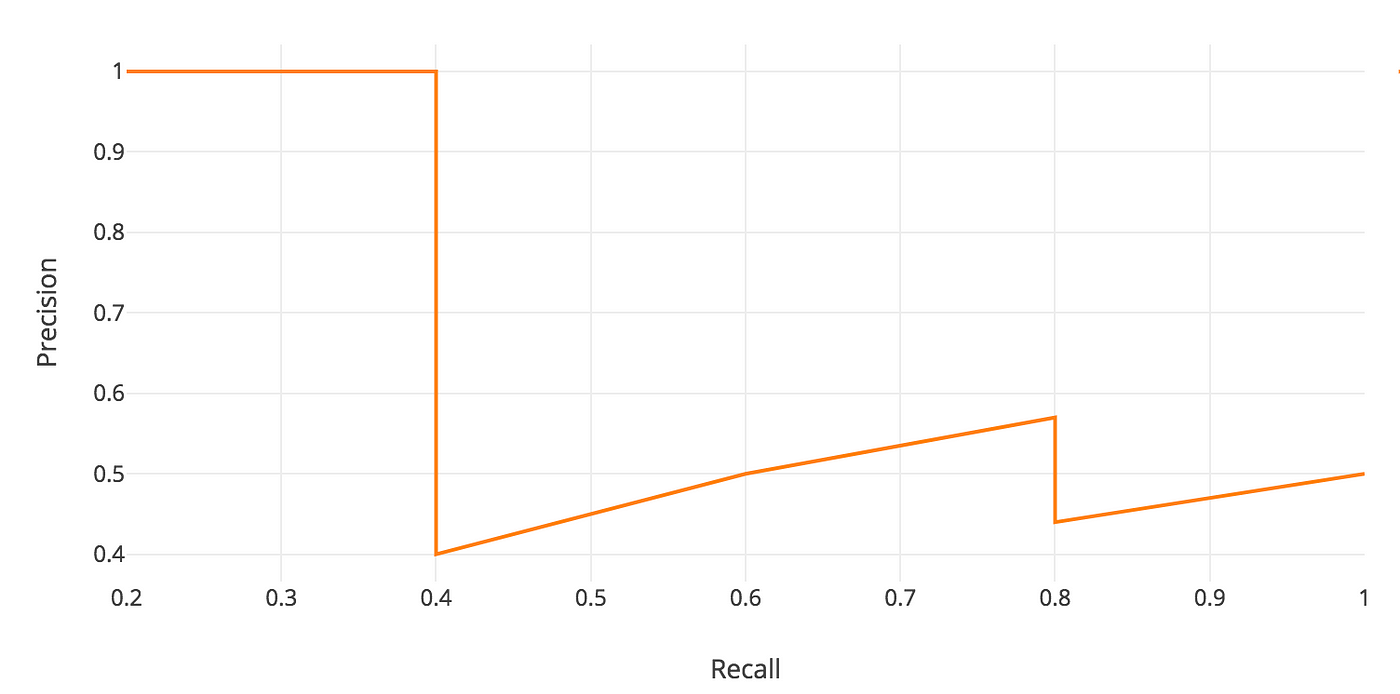
Precision-Recall curve is obtained by plotting the model’s precision and recall values as a function of the model’s confidence score threshold.
The idea is that you try different IoU thresholds and plot that performance. When you increase your score threshold, you increase your precision (because you are stricter on your guesses). However, your recall decreases (because you are guessing less, and so you might miss some actual positive classes). Example:
| Score Threshold | 0.9 | 0.8 | 0.7 | 0.6 | 0.5 | 0.4 | 0.3 | 0.2 | 0.1 |
|---|---|---|---|---|---|---|---|---|---|
| Precision | 1 | 0.75 | 0.6 | 0.6 | 0.6 | 0.6 | 0.6 | 0.6 | 0.6 |
| Recall | 0.5 | 0.75 | 0.75 | 0.75 | 0.75 | 0.75 | 0.75 | 0.75 | 0.75 |
 The precision-recall curve encapsulates the tradeoff of both precision and recall and maximizes the effect of both metrics. It gives us a better idea of the overall accuracy of the model.
Why not just use accuracy? See Accuracy (ML).

Mean Average Precision (mAP)
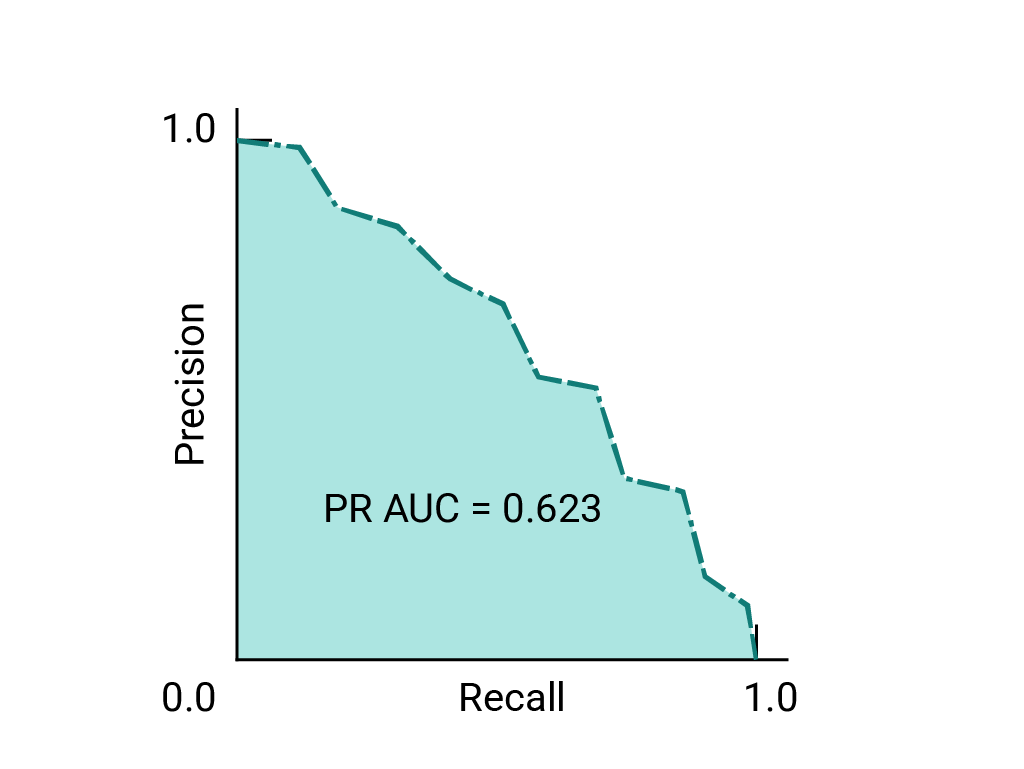
Average Precision is NOT the average of the precision. Rather, it is the area under the precision-recall curve.
Over the years, AI researchers have tried to combine precision and recall into a single metric to compare models, which is where mAP comes into play. https://www.v7labs.com/blog/mean-average-precision https://towardsdatascience.com/map-mean-average-precision-might-confuse-you-5956f1bfa9e2
The mAP is calculated by finding Average Precision(AP) for each class and then average over a number of classes.
Why do we use mAP instead of just precision? Because if you just have 100% precision, that is not significant. If your IoU threshold is 0.99, then a lot of your predictions are not going to go through, so you have very low mAP (precision in general) (but your recall is very high because you have very few FN). As you reduce your IoU threshold, your mAP precision is going to increase, because you can make more predictions. However, you will have a lower recall.
https://blog.paperspace.com/mean-average-precision/amp/