CUDA Nsight Systems (nsys)
nsys is the Nsight Systems command line tool. It ships with the CUDA toolkit, and is a powerful tool for profiling accelerated applications.
Basic Command
nsys profile --stats=true ./executableResources
- https://dev-discuss.pytorch.org/t/using-nsight-systems-to-profile-gpu-workload/59
- https://forums.developer.nvidia.com/t/can-not-get-cuda-python-backtrace/250319
- https://forums.developer.nvidia.com/t/nsight-system-not-show-python-code-and-line-number-in-python-backtrace/318657
To get line numbers, I needed to add --pytorch=functions-trace which gives the call stack information
--trace=cuda,nvtx,osrt --python-sampling=true --python-backtrace=cuda --cudabacktrace=all --pytorch=functions-trace,autograd-nvtx
There’s a much cleaner and easier way to use this profiler in jupyter notebook. That is what I use.
You should do it profiling and optimizing this program as practice:
Resources
Exercise: Profile an Application with nsys
nsys profile will generate a qdrep report file which can be used in a variety of manners. We use the --stats=true flag here to indicate we would like summary statistics printed. There is quite a lot of information printed:
- Profile configuration details
- Report file(s) generation details
- CUDA API Statistics
- CUDA Kernel Statistics
- CUDA Memory Operation Statistics (time and size)
- OS Runtime API Statistics
In this lab you will primarily be using the 3 sections in bold above. In the next lab, you will be using the generated report files to give to the Nsight Systems GUI for visual profiling.
GUI
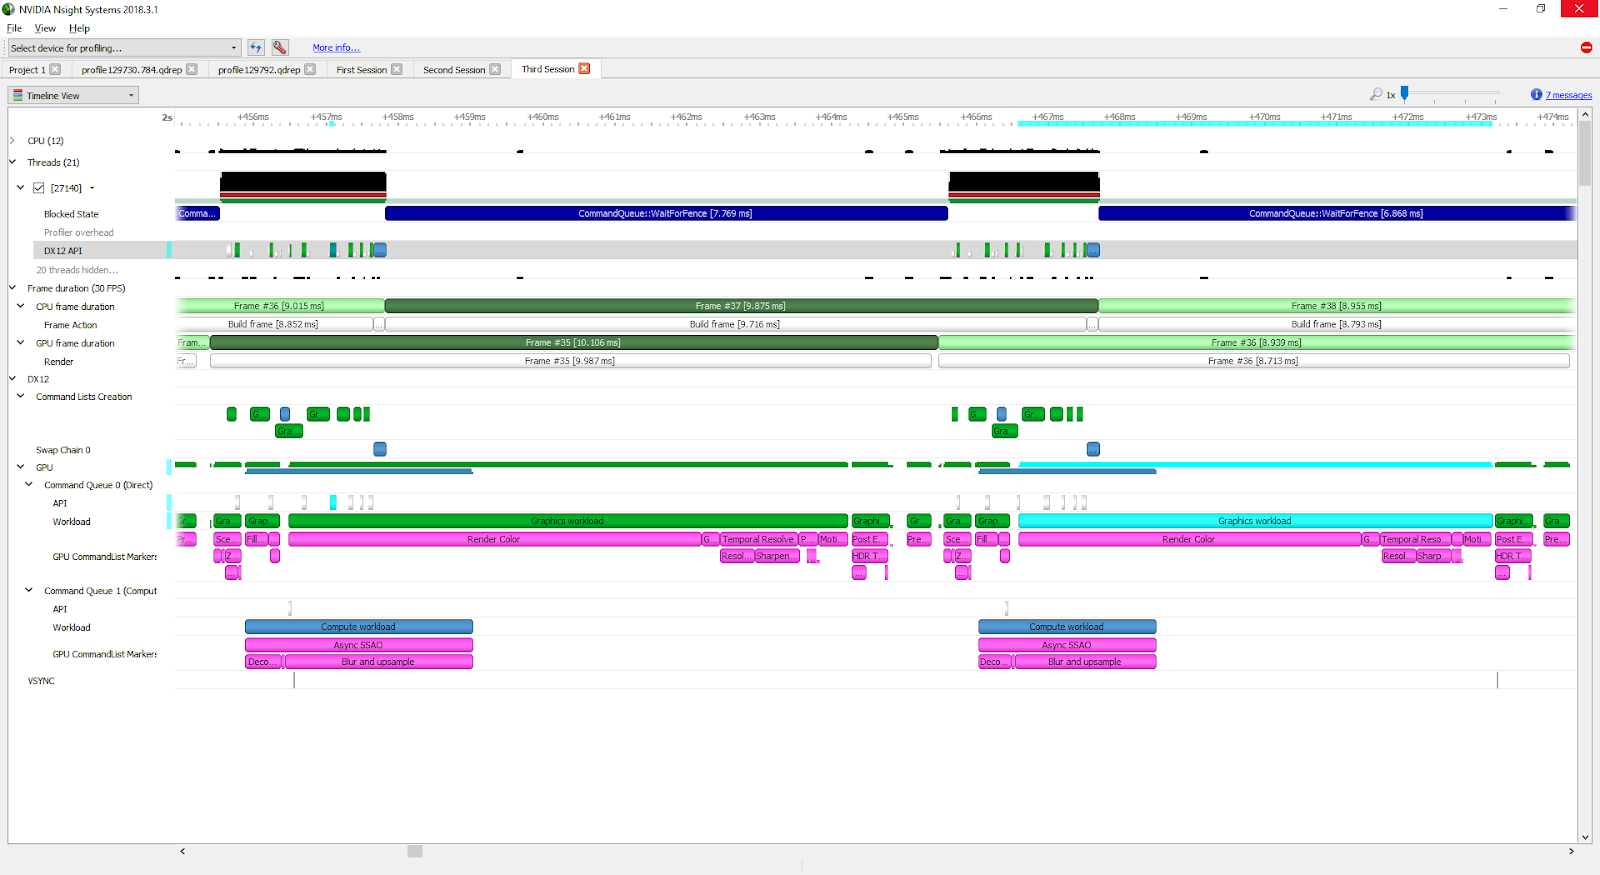
This is pretty cool. There are 2 things to expand, you don’t want to expand threads.
You want to expand the kernels and see that the functions are running in a way that you expect (through multiple CUDA Stream for example).
Nsys Profile
nsys profile provides output describing UM behavior for the profiled application. In this exercise, you will make several modifications to a simple application, and make use of nsys profile after each change, to explore how UM data migration behaves.
In order to test your hypotheses, compile and profile your code using the code execution cells below. In the output of nsys profile --stats=true you should be looking for the following:
- Is there a CUDA Memory Operation Statistics section in the output?
- If there is, that means there is UM migration
- If so, does it indicate host to device (HtoD) or device to host (DtoH) migrations?
- When there are migrations, what does the output say about how many Operations there were? If you see many small memory migration operations, this is a sign that on-demand page faulting is occurring, with small memory migrations occurring each time there is a page fault in the requested location.
Warning: LBR backtrace method is not supported on this platform. DWARF backtrace method will be used.
WARNING: The command line includes a target application therefore the CPU context-switch scope has been set to process-tree.
Collecting data...
Processing events...
Saving temporary "/tmp/nsys-report-25a0-9c88-9ba0-2b0d.qdstrm" file to disk...

Creating final output files...
Processing [==============================================================100%]
Saved report file to "/tmp/nsys-report-25a0-9c88-9ba0-2b0d.qdrep"
Exporting 2990 events: [==================================================100%]

Exported successfully to
/tmp/nsys-report-25a0-9c88-9ba0-2b0d.sqlite


CUDA API Statistics:

 Time(%)  Total Time (ns)  Num Calls    Average     Minimum    Maximum           Name
 -------  ---------------  ---------  -----------  ---------  ---------  ---------------------
    76.2        231079594          1  231079594.0  231079594  231079594  cudaMallocManaged
    20.7         62739750          1   62739750.0   62739750   62739750  cudaDeviceSynchronize
     3.0          9119394          1    9119394.0    9119394    9119394  cudaFree
     0.0           130941          1     130941.0     130941     130941  cudaLaunchKernel


CUDA Kernel Statistics:

 Time(%)  Total Time (ns)  Instances   Average    Minimum   Maximum            Name
 -------  ---------------  ---------  ----------  --------  --------  -----------------------
   100.0         62737327          1  62737327.0  62737327  62737327  deviceKernel(int*, int)


CUDA Memory Operation Statistics (by time):

 Time(%)  Total Time (ns)  Operations  Average  Minimum  Maximum              Operation
 -------  ---------------  ----------  -------  -------  -------  ---------------------------------
    52.6         23556910        1101  21395.9     2207   170076  [CUDA Unified Memory memcpy HtoD]
    47.4         21243678         768  27661.0     1631   165212  [CUDA Unified Memory memcpy DtoH]


CUDA Memory Operation Statistics (by size in KiB):

   Total     Operations  Average  Minimum  Maximum               Operation
 ----------  ----------  -------  -------  --------  ---------------------------------
 131072.000         768  170.667    4.000  1020.000  [CUDA Unified Memory memcpy DtoH]
 131072.000        1101  119.048    4.000  1020.000  [CUDA Unified Memory memcpy HtoD]


Operating System Runtime API Statistics:

 Time(%)  Total Time (ns)  Num Calls   Average    Minimum   Maximum              Name
 -------  ---------------  ---------  ----------  -------  ---------  --------------------------
    83.4       1114691473         59  18893075.8    55491  100136881  poll
     9.2        123291205         51   2417474.6    13262   20664569  sem_timedwait
     6.3         84353996        666    126657.7     1020   17482972  ioctl
     0.9         11818059         92    128457.2     1264    8910102  mmap
     0.1          1553954         82     18950.7     5125      38141  open64
     0.0           203989          4     50997.3    35366      72846  pthread_create
     0.0           171572         25      6862.9     1614      28292  fopen
     0.0           168785          3     56261.7    53337      61366  fgets
     0.0            92995         11      8454.1     4360      17604  write
     0.0            44740          5      8948.0     1326      12412  pthread_rwlock_timedwrlock
     0.0            38490          5      7698.0     3756      10110  open
     0.0            37483          7      5354.7     3298       8327  munmap
     0.0            35962          6      5993.7     1318      16299  fgetc
     0.0            33454         18      1858.6     1097       5396  fclose
     0.0            23634         12      1969.5     1017       3235  read
     0.0            18607          2      9303.5     8056      10551  socket
     0.0            16896         12      1408.0     1008       4647  fcntl
     0.0            12527          1     12527.0    12527      12527  sem_wait
     0.0            10224          1     10224.0    10224      10224  connect
     0.0             9610          1      9610.0     9610       9610  pipe2
     0.0             9417          2      4708.5     4321       5096  fread
     0.0             9341          4      2335.3     1775       2909  mprotect
     0.0             2756          1      2756.0     2756       2756  bind
     0.0             2255          1      2255.0     2255       2255  listen

Report file moved to "/dli/task/report9.qdrep"
Report file moved to "/dli/task/report9.sqlite"
My understanding:
- With CUDA, there is this layer of abstraction that you can just access the same memory if you use
cudaMallocManaged. However, if you down the layer of abstraction, you will see that there is this concept of Unified Memory. And every time you switch between CPU access and GPU access, you will need to copy the memory stuff, but it gives you the “illusion” that you are actually accessing the same piece of memory.
They show you a lower layer of abstraction so that you can write faster code.
- Everytime you see host to device (HtoD) or device to host (DtoH) migrations, that is the copying that is being done