NVIDIA Nsight Systems (nsys)
nsys is the Nsight Systems command line tool. It ships with the CUDA toolkit, and is a powerful tool for profiling accelerated applications.
Basic Command
nsys profile --stats=true ./executableVideo
Mastering Nvidia Nsight GPU Profiling
Use Jupter Notebook DEBUGGER!
There’s a much cleaner and easier way to use this profiler in jupyter notebook. That is what I use. See Jupyter Nsight.
https://developer.nvidia.com/nsight-systems
R maye do this course? https://learn.nvidia.com/courses/course-detail?course_id=course-v1:DLI+S-AC-14+V1
Resources
- https://developer.nvidia.com/nsight-systems/get-started#tutorials
- https://dev-discuss.pytorch.org/t/using-nsight-systems-to-profile-gpu-workload/59
- though you can use the Jupyter Nsight integration, a lot easier to work with
To get line numbers, I needed to add --pytorch=functions-trace which gives the call stack information
--trace=cuda,nvtx,osrt --python-sampling=true --python-backtrace=cuda --cudabacktrace=all --pytorch=functions-trace,autograd-nvtx
- TODO: insert tutorial video on how to do this
You should do it profiling and optimizing this program as practice:
Resources
How to read
https://docs.nvidia.com/nsight-systems/UserGuide/index.html#row-height
“Several of the rows in the timeline use height as a way to model the percent utilization of resources. This gives the user insight into what is going on even when the timeline is zoomed all the way out.”
Nsight Systems calculates the average occupancy for the period of time represented by particular pixel width of screen. It then uses that average to set the top of the colored section. So, for instance, if 25% of that timeslice the kernel is active, the bar goes 25% of the distance to the top of the row.
Backtracking: https://docs.nvidia.com/nsight-systems/UserGuide/index.html#example-of-using-timeline-with-function-table
Exercise: Profile an Application with nsys
nsys profile will generate a qdrep report file which can be used in a variety of manners. We use the --stats=true flag here to indicate we would like summary statistics printed. There is quite a lot of information printed:
- Profile configuration details
- Report file(s) generation details
- CUDA API Statistics
- CUDA Kernel Statistics
- CUDA Memory Operation Statistics (time and size)
- OS Runtime API Statistics
In this lab you will primarily be using the 3 sections in bold above. In the next lab, you will be using the generated report files to give to the Nsight Systems GUI for visual profiling.
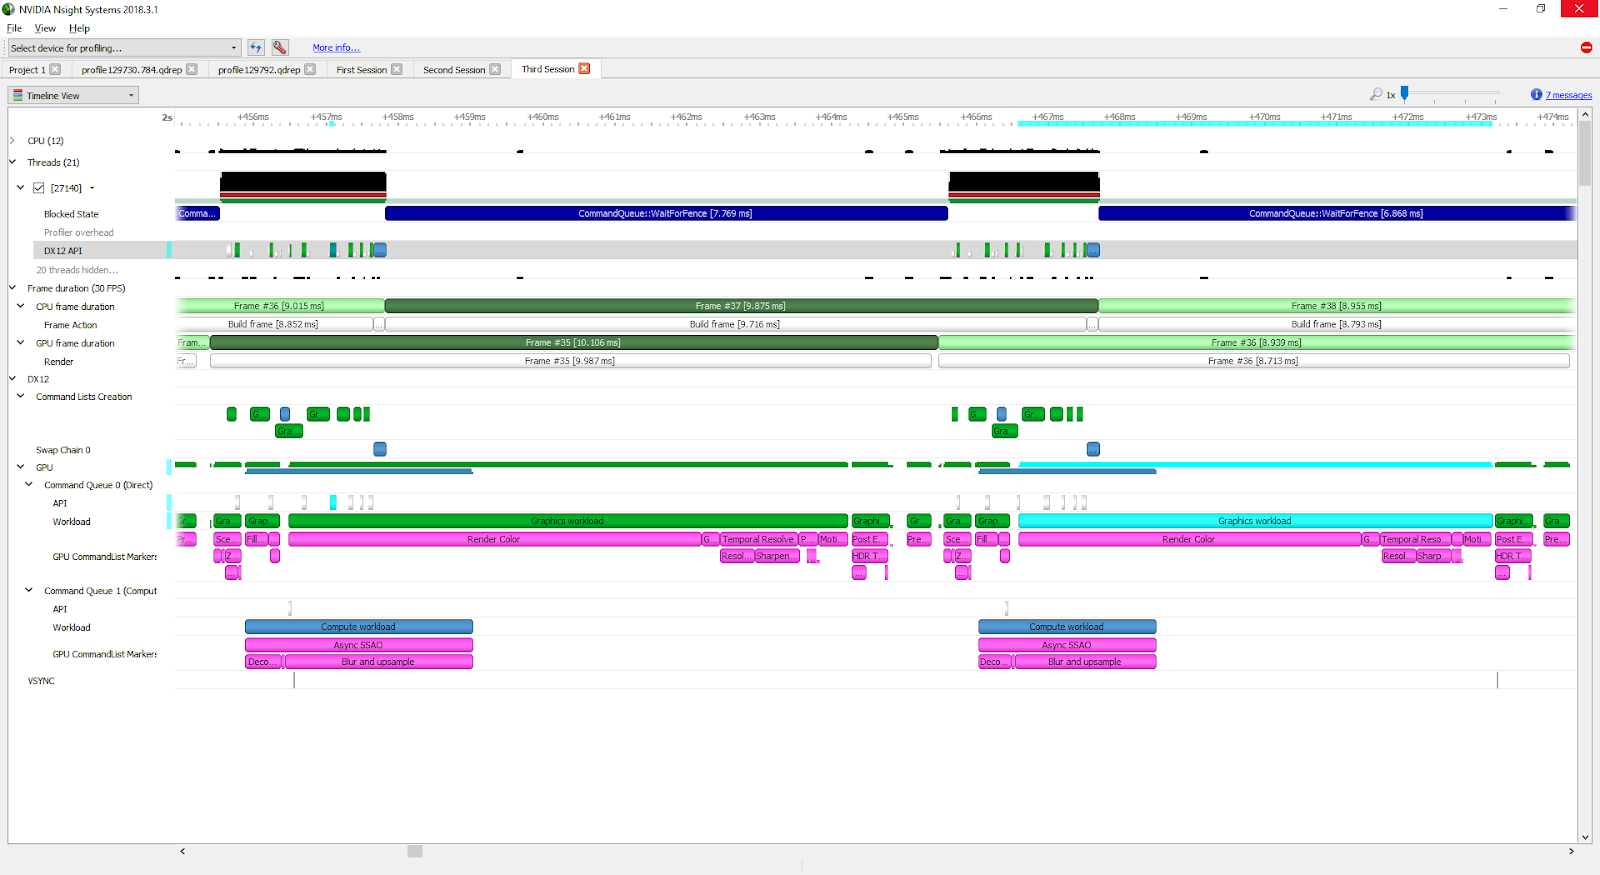
GUI
This is pretty cool. There are 2 things to expand, you don’t want to expand threads.
You want to expand the kernels and see that the functions are running in a way that you expect (through multiple CUDA Stream for example).
Nsys Profile
nsys profile provides output describing UM behavior for the profiled application. In this exercise, you will make several modifications to a simple application, and make use of nsys profile after each change, to explore how UM data migration behaves.
In order to test your hypotheses, compile and profile your code using the code execution cells below. In the output of nsys profile --stats=true you should be looking for the following:
- Is there a CUDA Memory Operation Statistics section in the output?
- If there is, that means there is UM migration
- If so, does it indicate host to device (HtoD) or device to host (DtoH) migrations?
- When there are migrations, what does the output say about how many Operations there were? If you see many small memory migration operations, this is a sign that on-demand page faulting is occurring, with small memory migrations occurring each time there is a page fault in the requested location.
My understanding:
- With CUDA, there is this layer of abstraction that you can just access the same memory if you use
cudaMallocManaged. However, if you down the layer of abstraction, you will see that there is this concept of Unified Memory. And every time you switch between CPU access and GPU access, you will need to copy the memory stuff, but it gives you the “illusion” that you are actually accessing the same piece of memory.
They show you a lower layer of abstraction so that you can write faster code.
- Everytime you see host to device (HtoD) or device to host (DtoH) migrations, that is the copying that is being done