Hypothesis Testing
I learned this in Enriched bio a while ago at Marianopolis College, I regret not learning this more seriously, as I have forgotten all of it now. Update: I am learning about it in STAT206!
Hypothesis is some claim (usually about a parameters) about the population.
Null Hypothesis (): “Current belief”; conventional wisdom Alternate Hypothesis (): Challenge to
There are two types of test
- Two-tailed (what we stick to in STAT206, using )
- One-tailed (using inequality or )
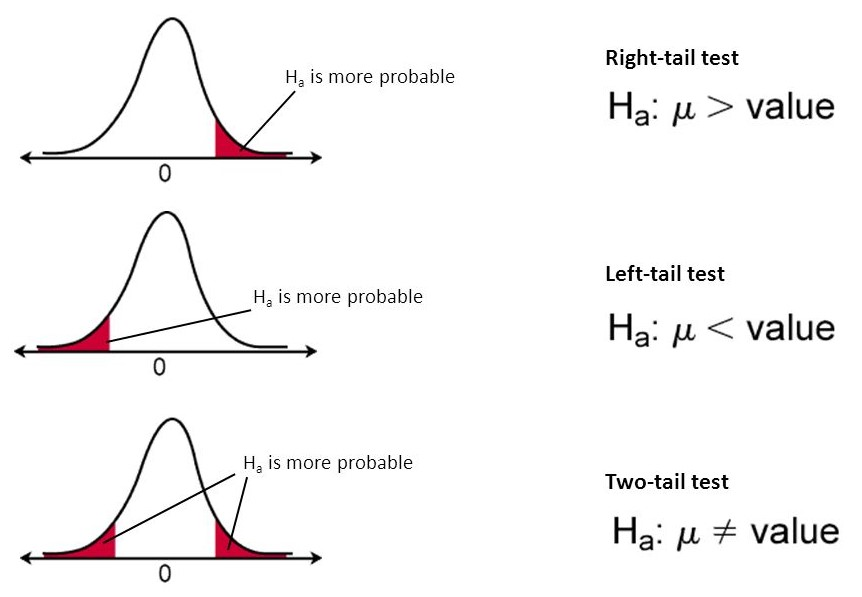
I finally understand this intuitively. If you fall within the region of rejection, then you reject your null hypothesis.
- We have enough evidence to support a claim that /
You should form your hypothsis.
4-Step Method for Hypothesis Testing
- Construct the Test Statistic
- Calculate the value of the Test Statistic
- Seems like we use the Pivotal Quantity for the appropriate distribution
- Compute the p-value
- This is a little hard and intimidating, I don’t know what values I should be looking at
- Okay, I am starting to get it. I think you need to be careful about which test to use. If you
- If you variance is known, use Z-Table.
- If your variance is unknown, use the T-table, where your DOF is .
- There is also DOF of if you are doing linear regression??
- Draw appropriate conclusions for the -value
- reject , fail to reject
- We can also say “we have enough evidence to support ”
- fail to reject , reject
- You can’t say the other way around, since 0.05 is not enough. You need to have another test
- “There does not appear to be a difference between enough evidence to show that ”
- reject , fail to reject
Standard testing for a mean:
- There is not enough evidence to show a particular mean?? But that is kind of iffy
Comparing two means:
- Support of : There is not enough evidence to show that the means are the same
- Support of : There is not enough evidence to show that the means are different
Linear
- There seems to be linear relationships between X and Y.
- There is not enough evidence to show that a linear relationship exists between X and Y.
Normal Hypothesis Testing
Let’s illustrate the 4-step method through an example of normal hypothesis testing.
Suppose , s are independent. and . We want to test the following hypothesis:
Can we conclude that our sample data supports ?
Step 1: Construct the Test Statistic
See Test Statistic for more information. We’ve seen this before in Test Statistic for more information. We’ve seen this before in Confidence Interval: You conclude that you have the following value:
Step 2: Calculate the Test Statistic
Step 3: Compute the p-value
- If you variance is known, use Z-Table.
- If your variance is unknown, use the T-table, where your DOF is .