Confidence Interval
A confidence interval (CI) is a range of estimates for an unknown parameter.
The goal is to fix a probability, and then find an interval where % of such intervals conform to the parameter of interest.
Isn’t that what we did for the Likelihood Interval??
- unknown parameter (a constant i.e , etc), - estimate to → a # calculated based on data - , etc. - a RV that corresponds to - RV of which is an outcome
Confidence Interval (Definition)
A % Confidence Interval for is an estimate of the interval
for RVs, and , such that
The interval
Interpretation of Confidence Intervals
Suppose we have a 95% CI: , where , does NOT mean there is a 95% chance that the the interval contains the parameter. Instead, 95% of constructed CIs fall around (contain) the mean.
It means that 95% of intervals will contain
Also see Interval Estimation.
Example
Suppose that we have and we have collected and .
Construct the 95% Confidence Interval for .
We will do this in 3 steps:
- Construct the Pivotal Quantity
- Using the Pivotal Distribution, construct the Coverage Interval
- Estimate the coverage interval using your data
Step 1: Construct the Pivotal Quantity
The Pivotal quantity is given by From the above, we known , and , therefore
Step 2: Using the Pivotal distribution, construct the Coverage interval
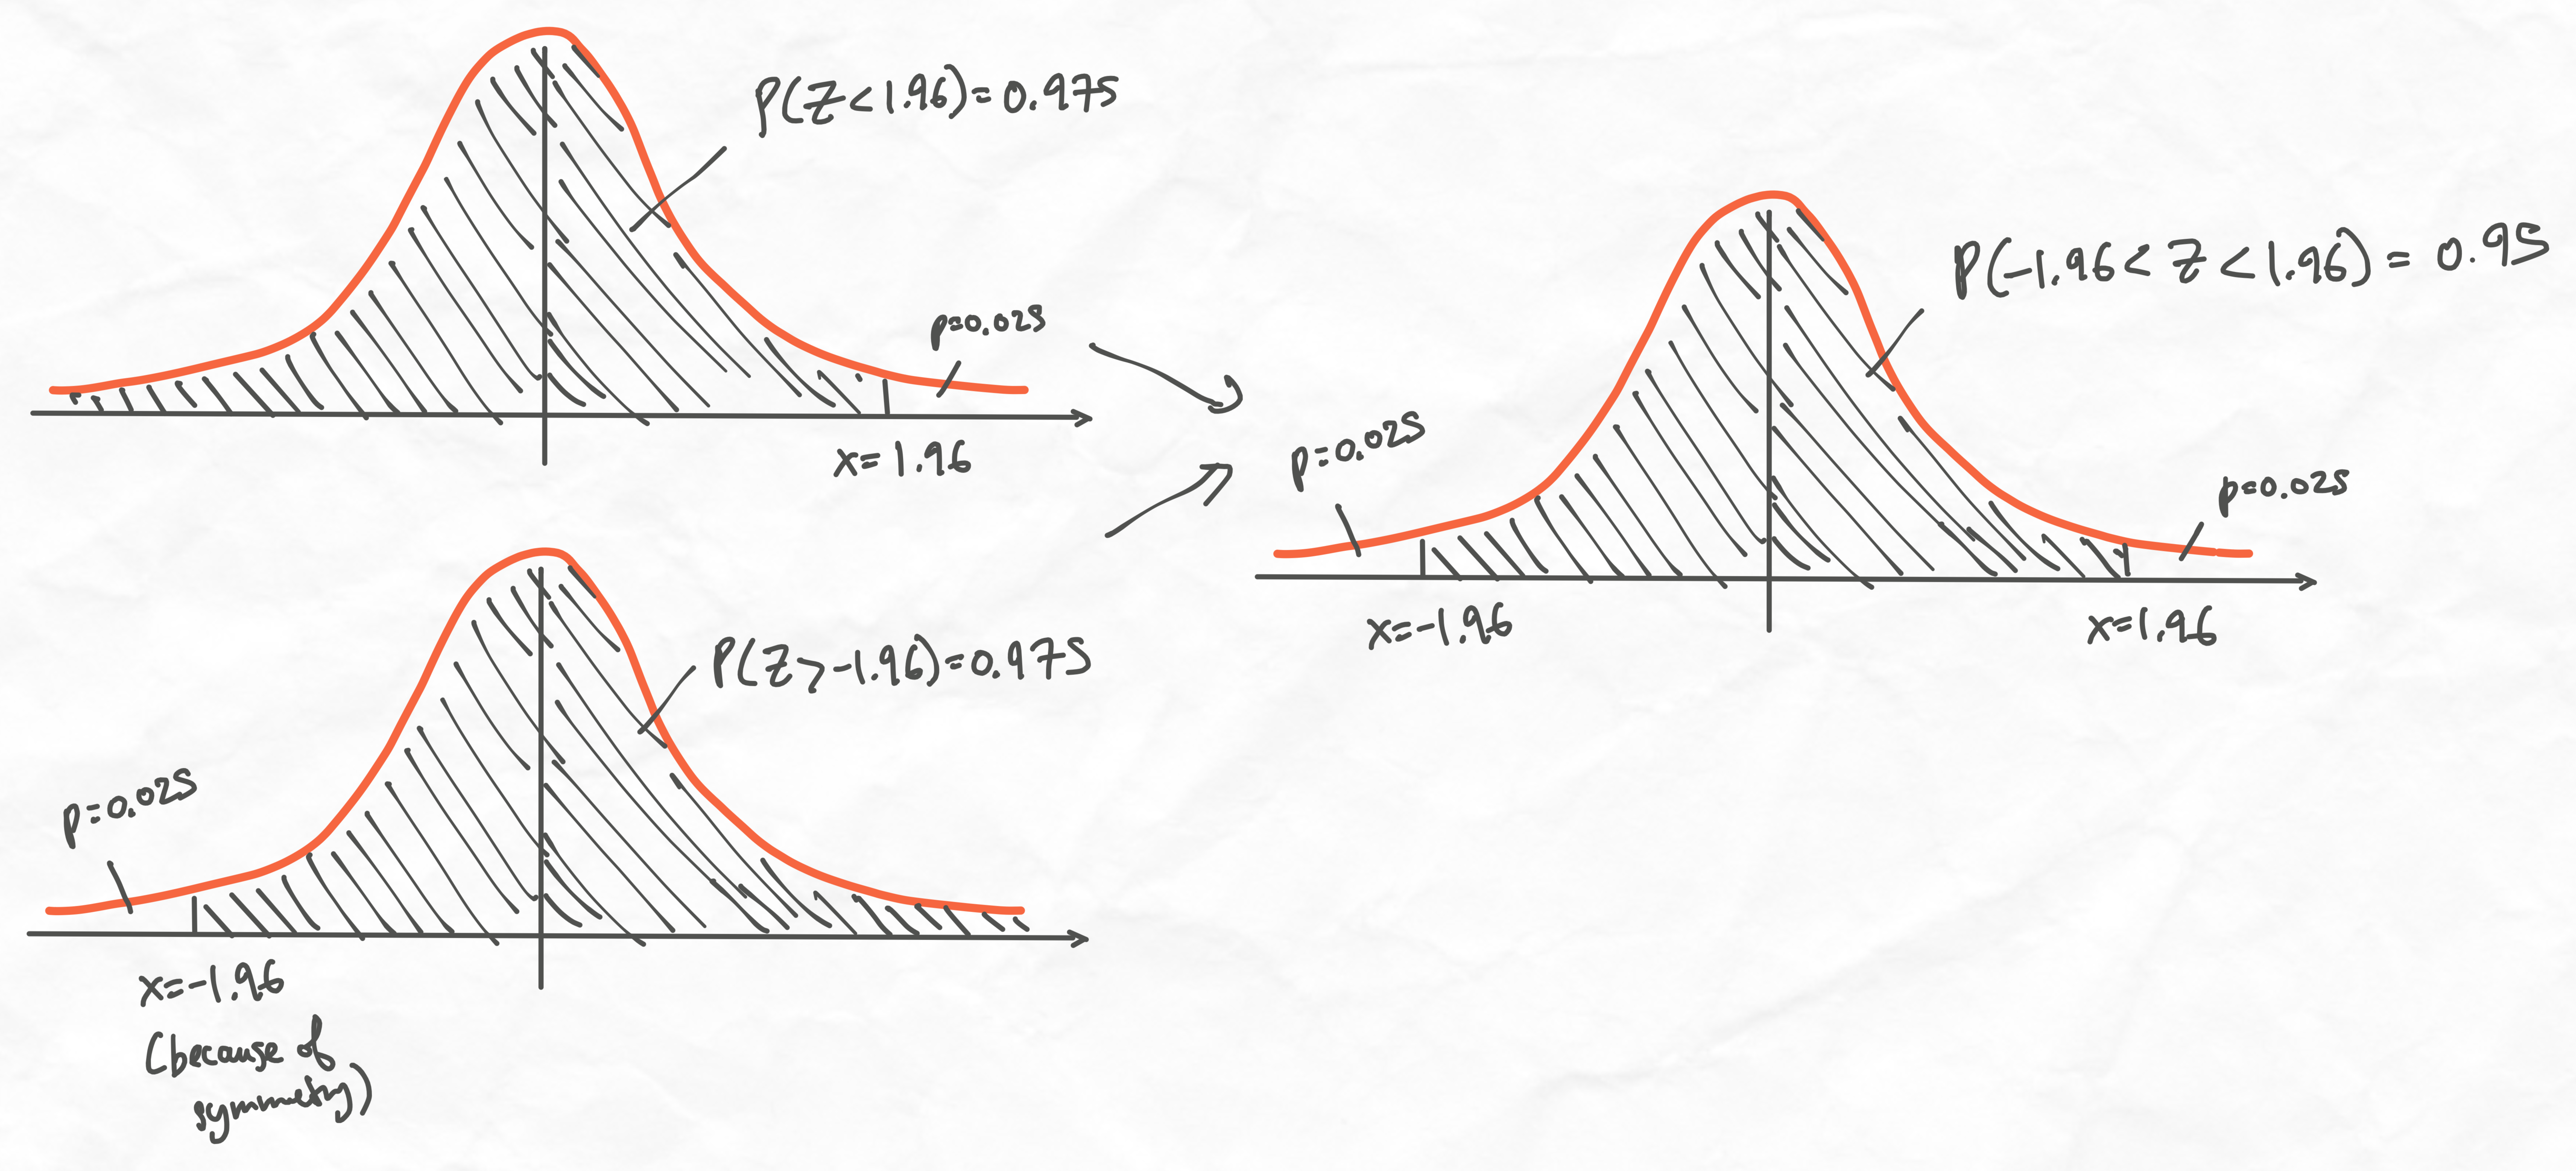
Since we want the 95% confidence interval, we look at the quantiles in the Z-Table for and find a value of of for . We do this because we want the centered around the mean.
Make sure to draw your Normal Distribution, writing down your numbers to really convince yourself.
- The general trick is just say, they ask you for the Y% interval. You should take the values as your bounds.
 Therefore, we get that
We then isolate for :
Step 3: Estimate the Coverage Interval using your data
Best estimate of is
- where is the Standard Error
So we obtain our final answer after fitting int he data:
Normal Confidence Intervals
I guess this is a summary of what we just did above?
- and are known parameters here
- The general format the the above is Mean critical value * Standard Error
Unknown and
However, sometimes, and are unknown to us. In these cases, we can still find the Confidence Interval for both parameters.
If are i.i.d. , and then
We can write this in terms of the Student’s t-Distribution to estimate the Student’s t-Distribution to estimate the Mean: We can also write this in terms of the Chi-Squared Distribution to estimate the Chi-Squared Distribution to estimate the Variance:
The above notation is confusing, so just some clarification:
- and are RVs, and and estimates
- The estimate of is . We say that is an Unbiased Estimator of but is biased.
- Basically, is what we actually see in our data, and to get it to be unbiased, we reduce it by one degree of freedom
CI for
are unknown.
A sample of 16 students were taken and it was calculated that and . Find a 90% CI for .
Step 1: Construct the Pivotal Quantity We have that Coverage Interval: 90% CI, and 15 DOF, looking at our t-table, we actually need to use the value that is for p=0.95 and .
Confidence Interval:
CI for
Pivotal Quantity: If are i.i.d. , and then
Coverage Interval: Confidence Interval:
Binomial CI
If , then we have following results:
Pivotal Quantity Pivotal Distribution Coverage Interval Confidence Interval
Poisson CI
If , then we have following results: Pivotal Quantity Pivotal Distribution Coverage Interval Confidence Interval