Normal Distribution
The MOST powerful distribution. Normal distribution is a probability distribution that is symmetric about the mean , where data near the mean occur more frequently.
Normal Distribution (Definition)
We say that a r.v. is normally distributed, , if its p.d.f., , is
where
- is the mean or expectation of the distribution (and also its median and mode),
- is its Standard Deviation
Normal Distribution is symmetrical around , i.e. where is the mean, mode, and median.
Expectation and Variance
- (the calculation for this is pretty messy)
Standard Normal Distribution (Definition)
The standard Normal Distribution has and , i.e. . We have the p.d.f.
I learned the matrix form from the SLAM book.
Multi-dimensional Normal Distribution (Matrix-Form Definition)
The probability density function is
Also see Gaussian Variable.
Where do we see gaussians in the real world?
- Height Distribution: Human heights follow a Gaussian distribution.
- IQ Scores: IQ scores typically follow a Gaussian distribution.
- Measurement Errors: Instrument measurement errors often have a Gaussian distribution.
- Stock Returns: Daily stock returns frequently exhibit a Gaussian distribution.
Unit Gaussian
Unit gaussian simple means that and .
- Heard this term from Karpathy, when talking about batch norm https://www.pinecone.io/learn/batch-layer-normalization/
Z-Table (Standard Normal z-table)
The z-table table gives values of the CDF for and .
What is really cool is that we can go from the standard normal distribution to another normal distribution with a particular mean and variance, using the theorem below:
Theorem
If and , then
Look at the page on Z-Score
Example Exercise
Example: Suppose that final grades in this course follow a normal
distribution with and .
-
Find the probability that a student has a final grade of 83 or more.
-
Calculate the 95th percentile.
-
We have that , so find
-
We solve this by using the Quantile table. Therefore, we conclude that
Part 2: A sample of 9 students is taken. Find
I’m not sure if I understand correctly, but there is this Variance of the mean value that I need to use, instead of the direct variance.
- (I don’t know if is correct, might be a typo)
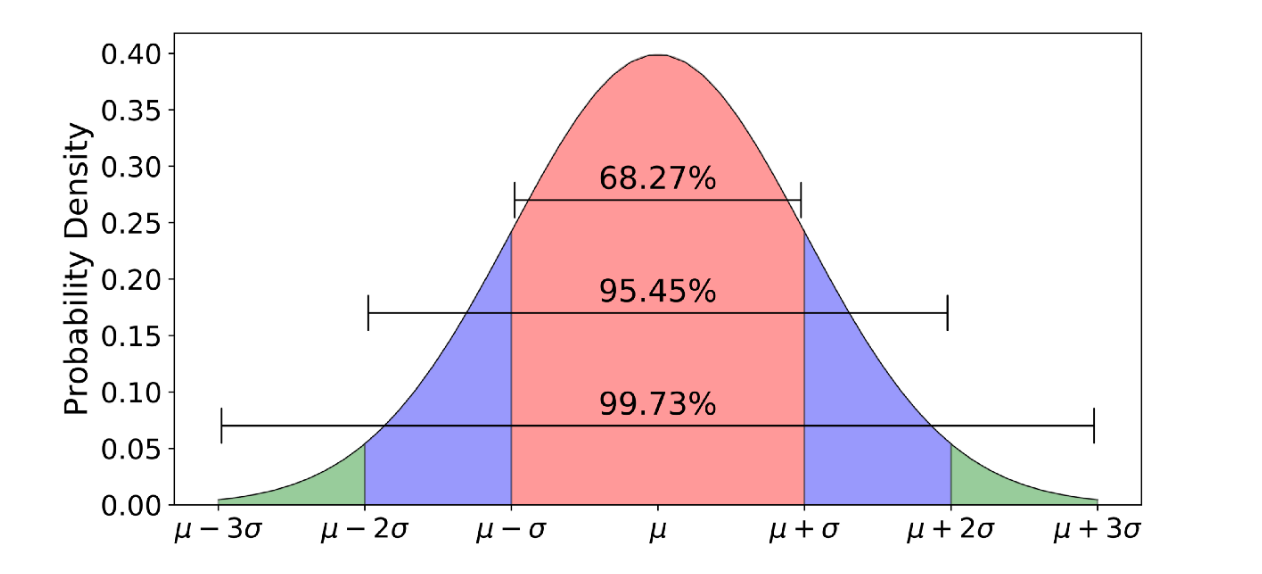
The 68-95-99 rule
The 68-95-99 rule is based on the mean and standard deviation. It says:
- 68% of the population is within 1 standard deviation of the mean.
- 95% of the population is within 2 standard deviation of the mean.
- 99.7% of the population is within 3 standard deviation of the mean.
Generating Normal Distributions in Code
To randomly sample from the Normal Distribution, we have a few options (Learned from Ericsson):